Construction Reporting & Analytics Software
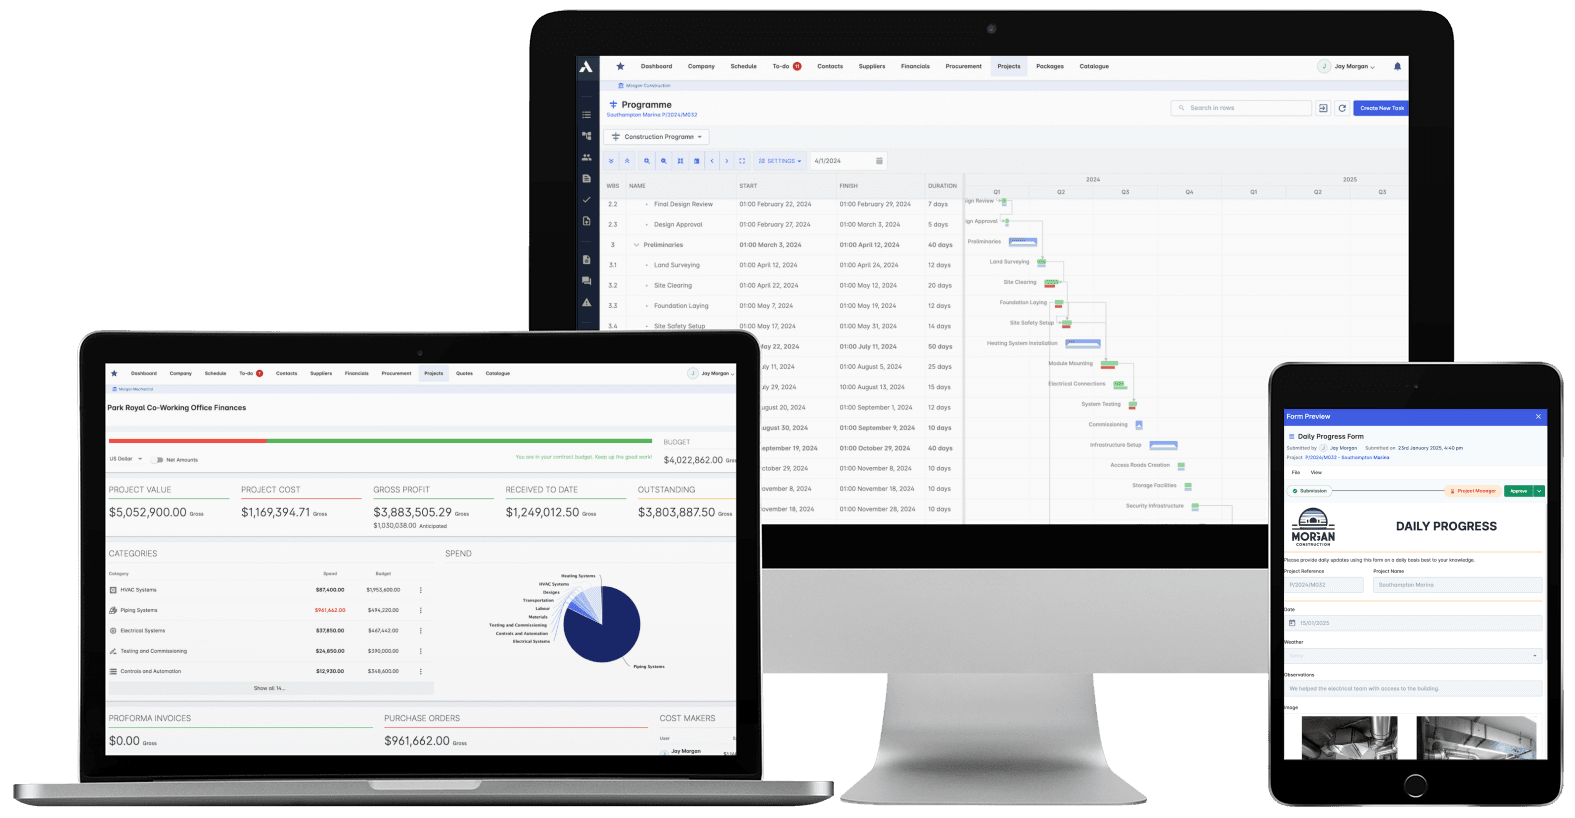
Reports nobody has to assemble.Cost, schedule, procurement, valuations and site data are already one dataset, so every dashboard and report is live by default. Board packs, client reports and project reviews built from the same numbers, not four exports and a weekend.
Trusted by construction companies of every size, worldwide




























Site, commercial and the board read the same numbers
Construction reporting software keeps every number in agreement by building dashboards and reports from one live data model instead of reconciled exports. In Archdesk, the cost figure, schedule position and valuation on any report are the same underlying records, so board packs, client reports and project reviews always agree with each other.

Nothing to reconcile at month end
Every report is a live view of the project, not a snapshot someone compiled, so board packs and client reports stop being an assembly job.
Overruns visible while they can still be fixed
Budget against actual updates as work happens, and change order impact shows in the numbers before it reaches the final account.
Reports send themselves
Scheduled distribution and custom templates put the right report in front of each stakeholder automatically, in the format they need.
Productivity measured, not guessed
Earned value, workforce productivity and equipment usage are tracked against the plan, so you know where performance is slipping and why.
Live by default
Because cost, schedule, procurement, valuations and site data are already one dataset, every dashboard is current the moment you open it. There is no report-building step and no competing version of the numbers.

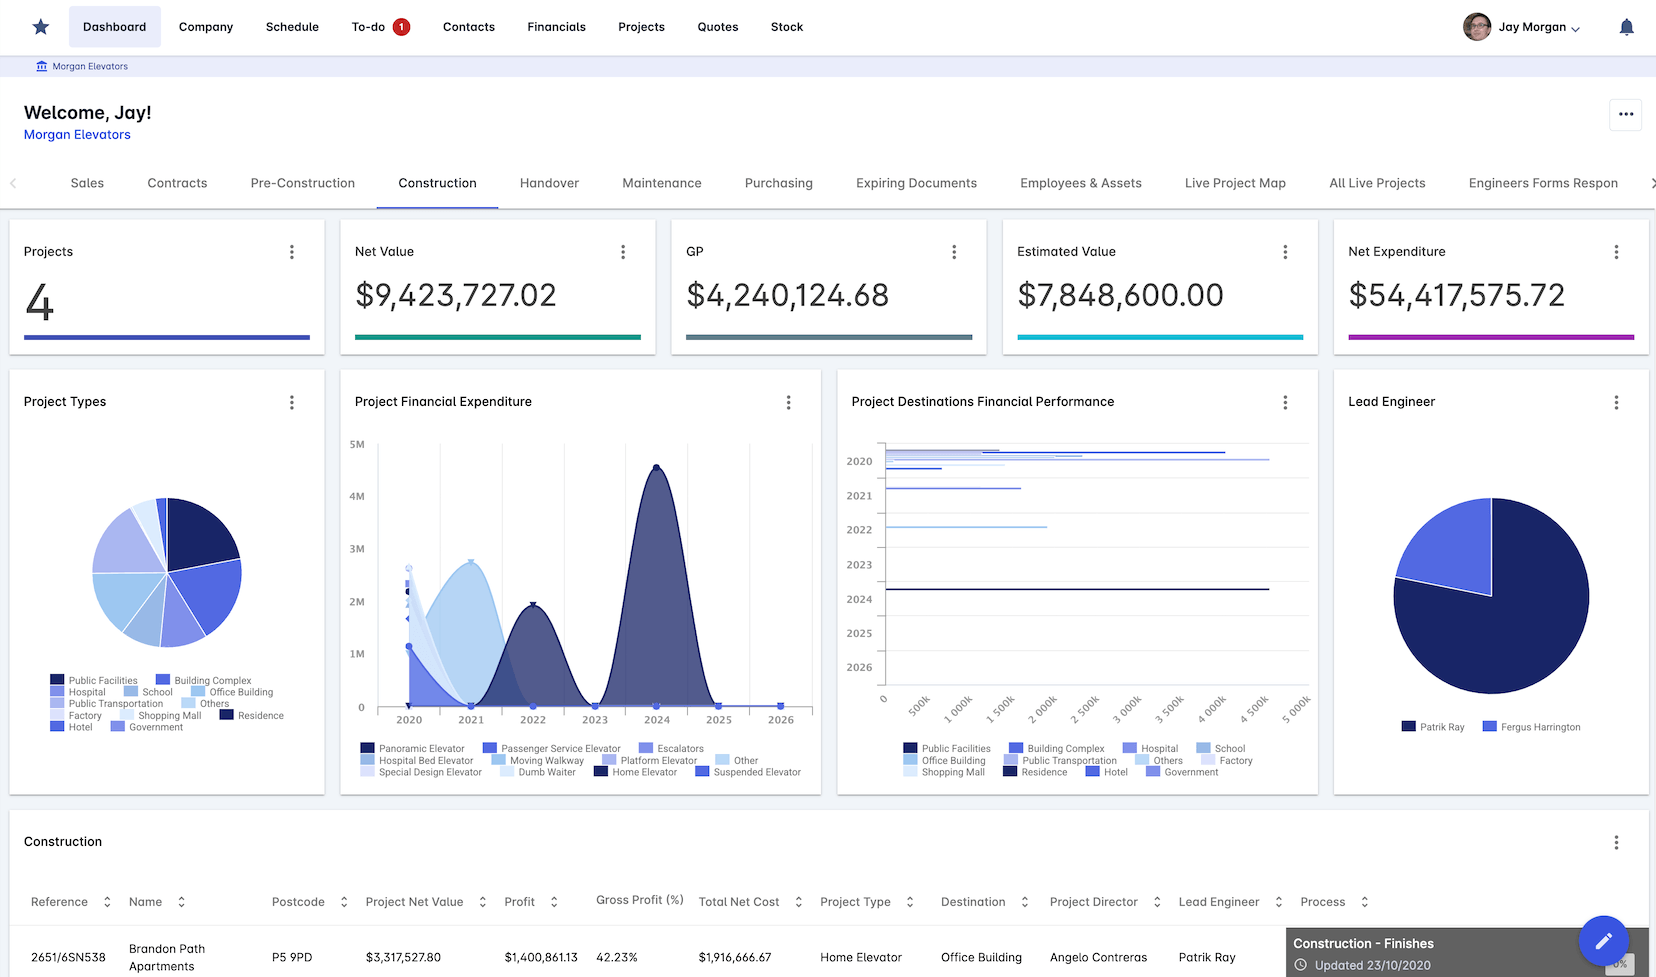
Real-time Project Insights
See how every project is performing as work happens, not at the month-end review. Costs, progress and resource usage update live across the whole portfolio.
Live status across every project
Costs tracked in real time
Schedule progress against the plan
Custom-defined KPIs for each project
Construction Analytics
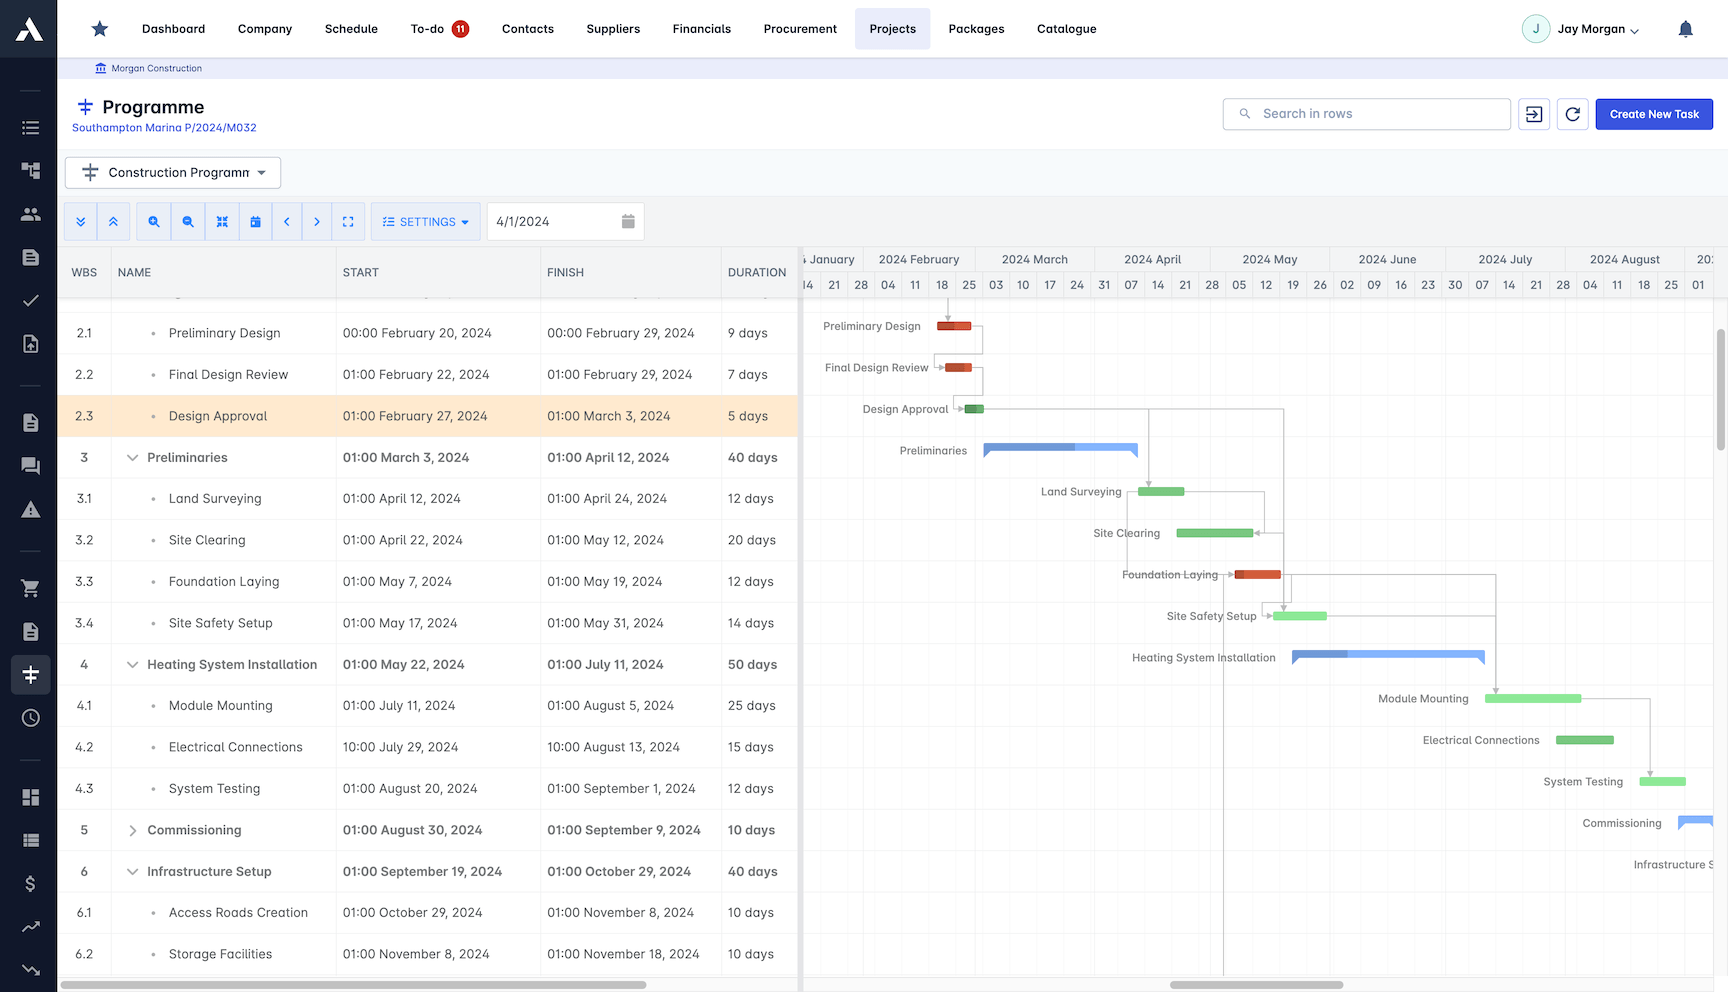
Analytics built for construction, not adapted to it. Gantt charts, cost breakdowns and resource views turn live project data into decisions you can defend.
Interactive Gantt charts on live data
Cost breakdown structures per project
Resource histograms across crews
Collision detection on the schedule
Automated Reporting
Reports generate and distribute themselves on schedule. Each stakeholder gets the right template in the right format, without anyone assembling it.
WIP reporting built in
Scheduled distribution to stakeholders
Custom templates per audience
Export in multiple formats
Performance Tracking
Track the metrics that show whether a project is really performing. Slipping productivity shows up in the numbers while there is still time to act.
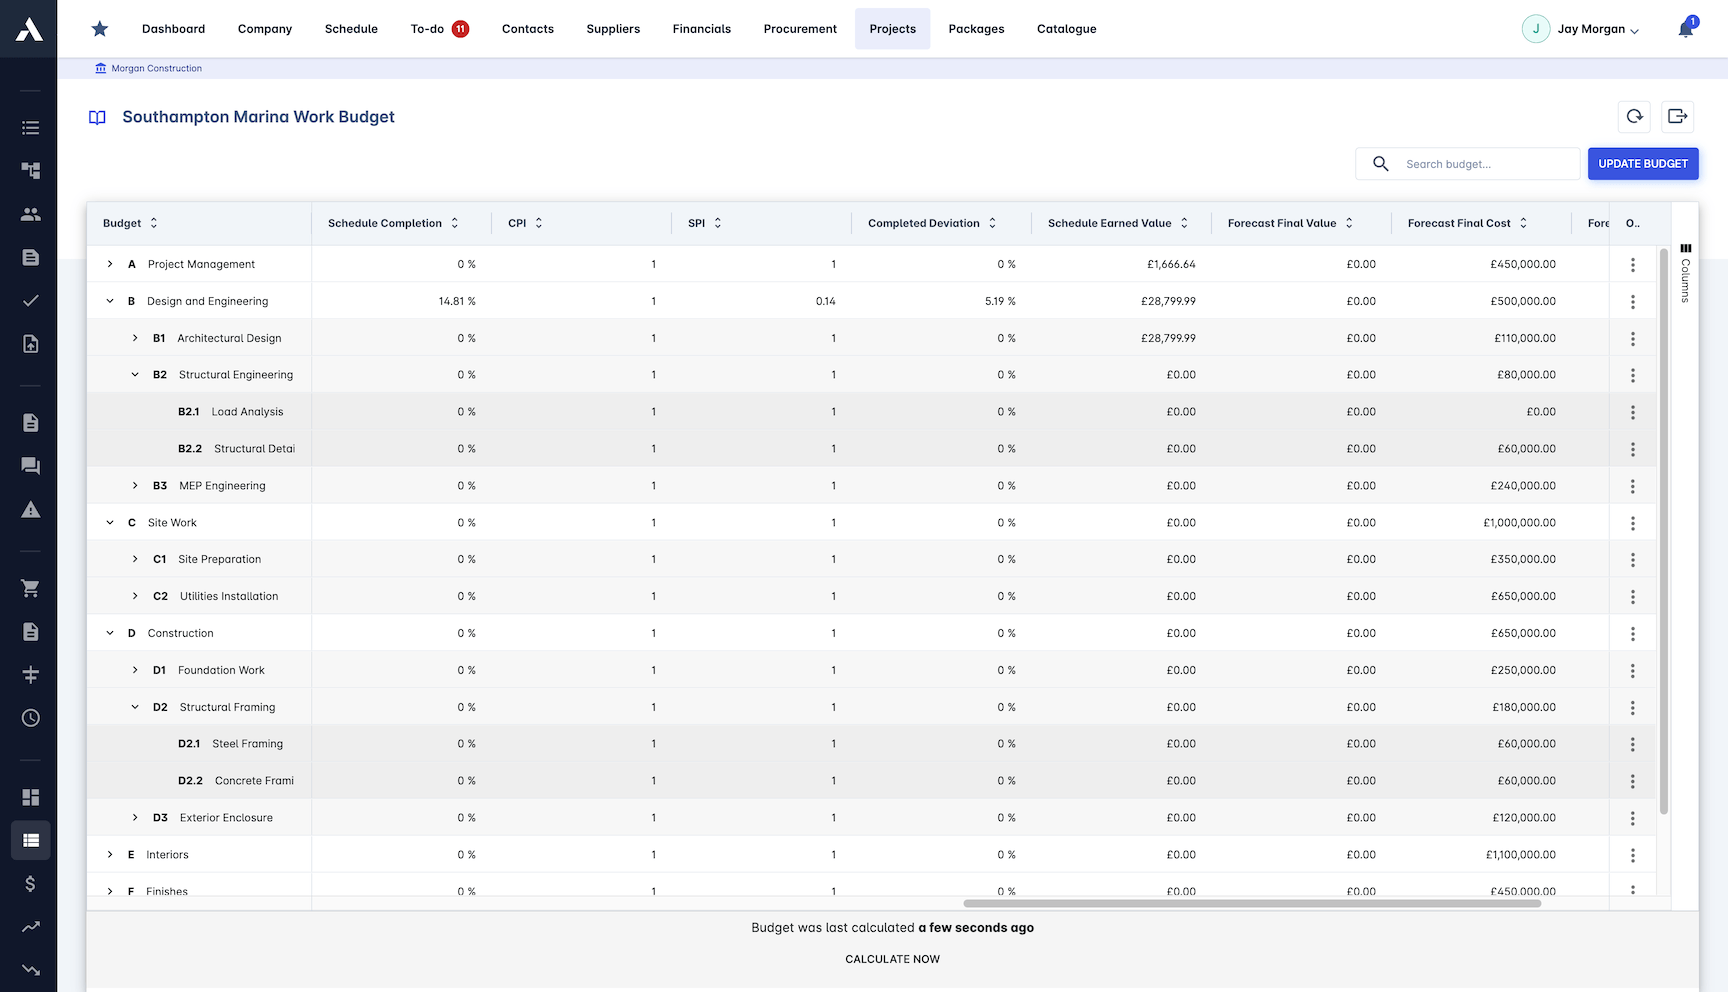
Earned value management (EVM)
CPI and SPI performance indices
Workforce productivity tracked over time
Equipment usage rates per project
Quality metrics on every project
Financial Intelligence
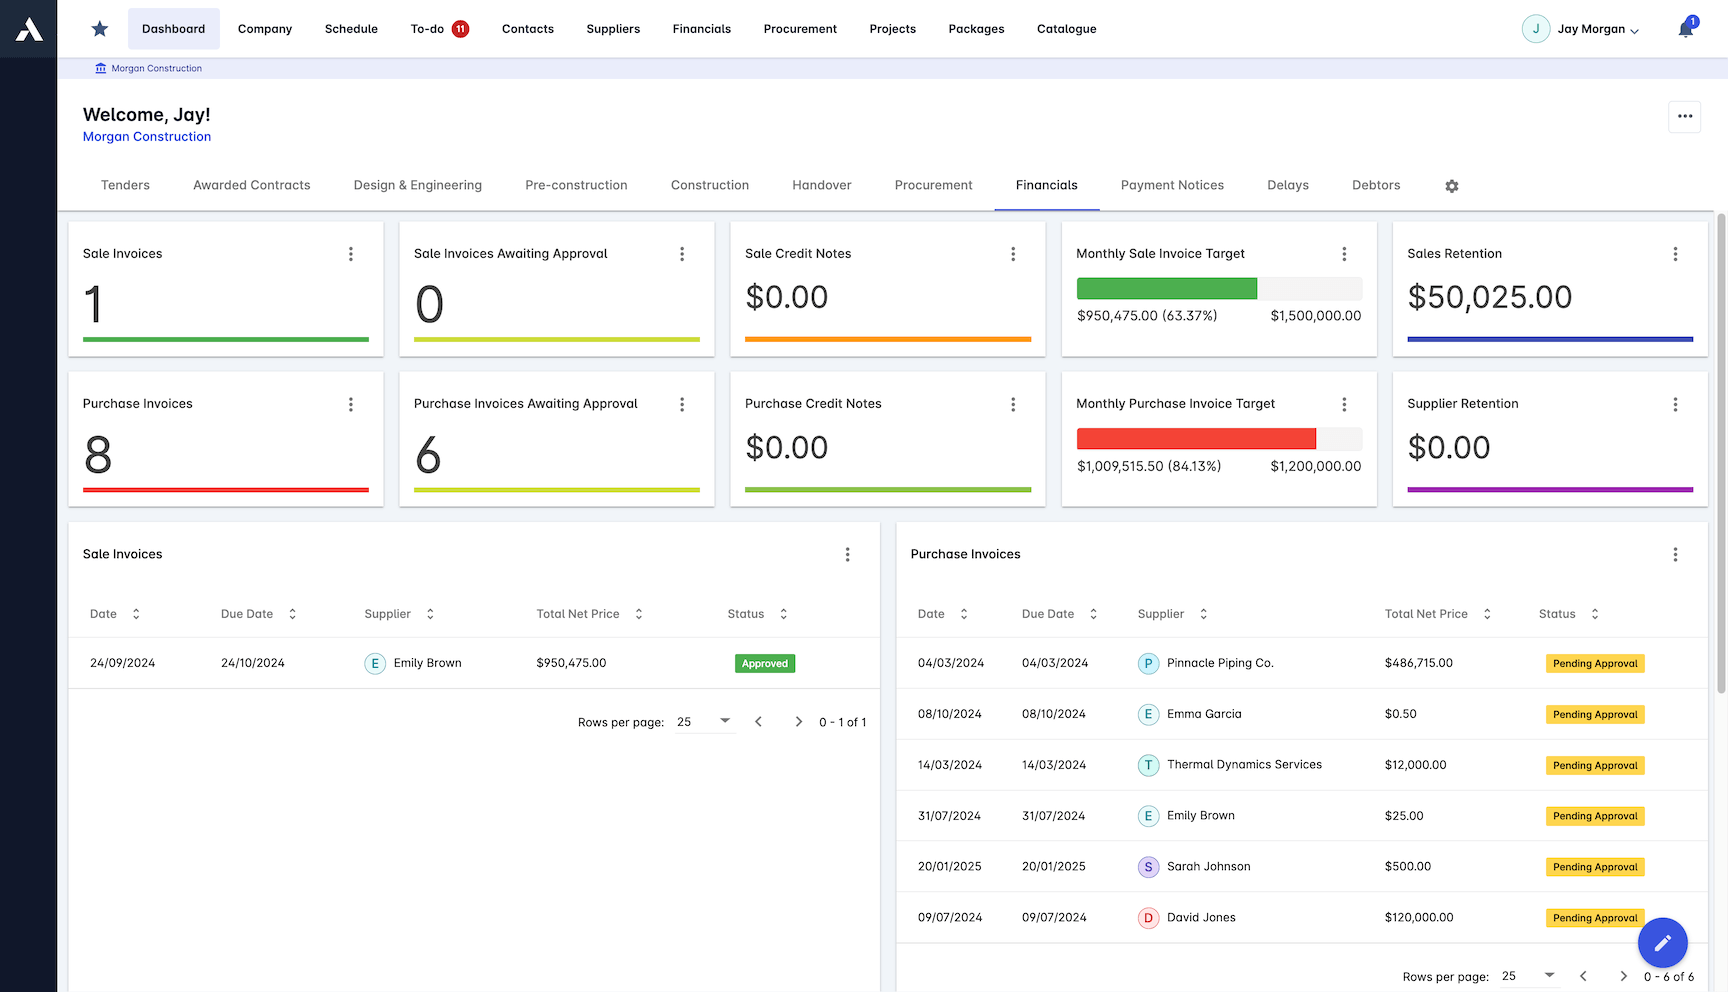
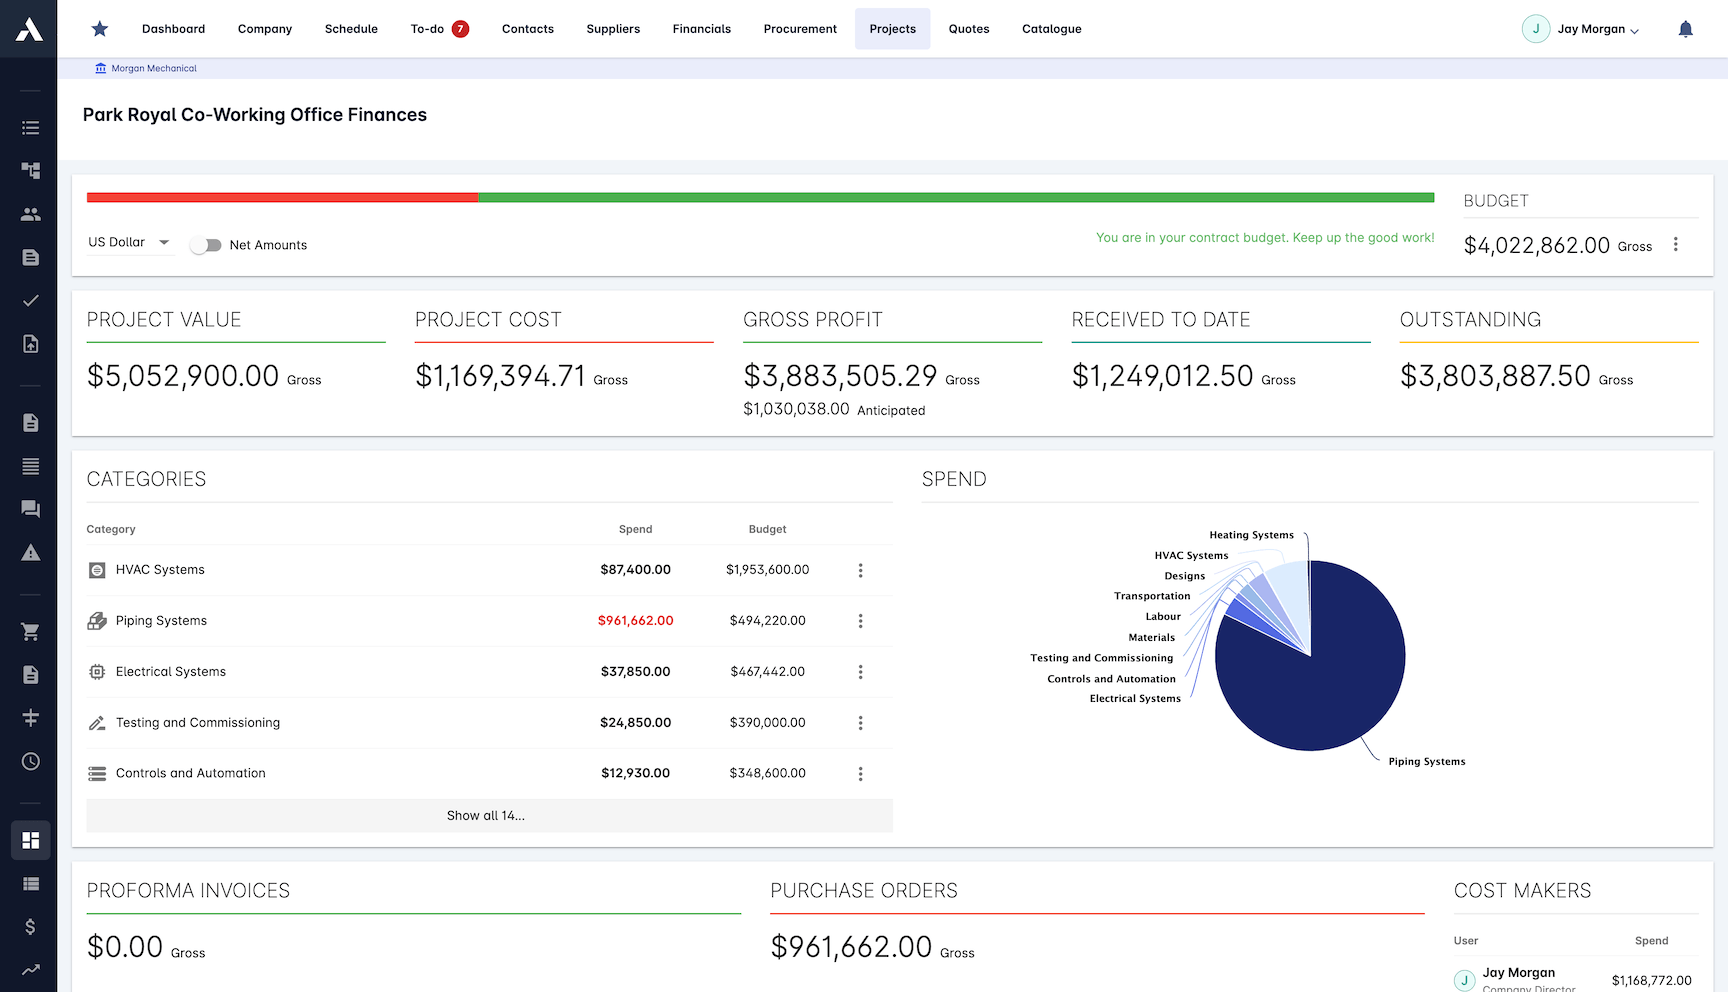
The financial position of every project, live. Cash flow, budget against actual and variation impact sit in one view, so forecasts rest on real numbers.
Cash flow forecasting per project
Budget vs actual on every cost line
Change order impact in the numbers
Profitability tracked by project
Custom Dashboard Builder
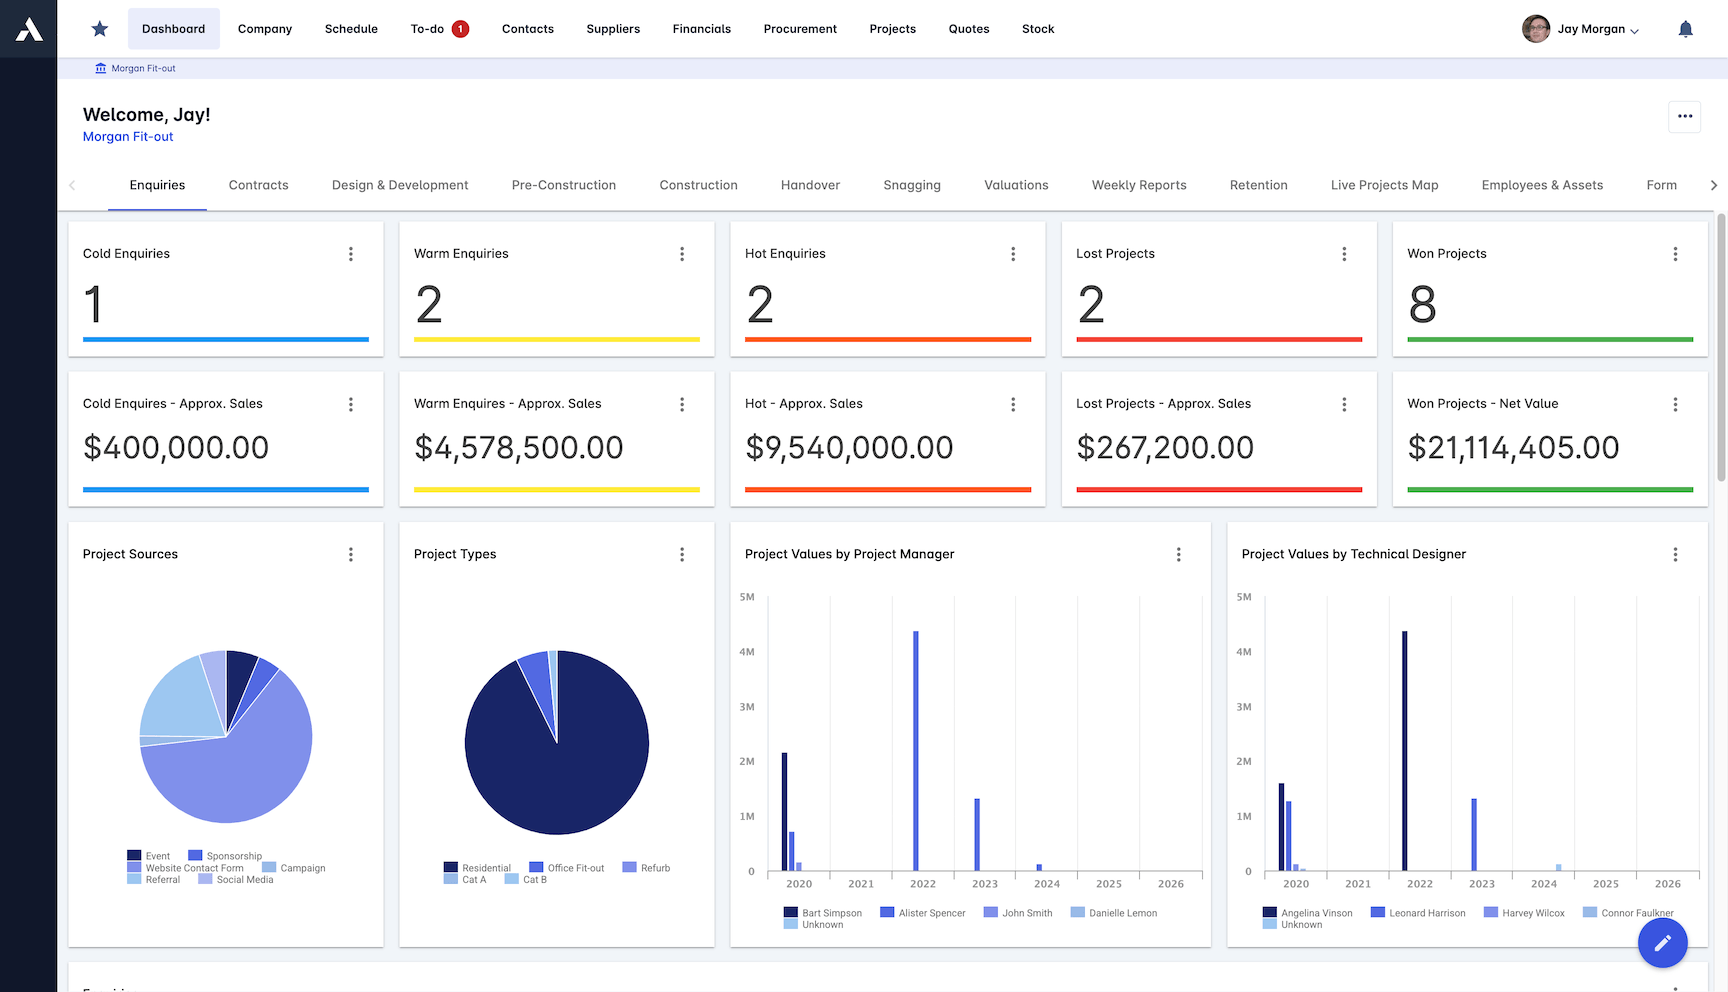
Build the dashboard each role actually needs with drag-and-drop widgets. Site, commercial and board each get their own view of the same live data.
Drag-and-drop dashboard creation
Widget library for construction metrics
Role-based sharing and saved templates
Live data on any device
Frequently Asked Questions: Construction Reporting & Analytics
What makes construction reporting in Archdesk real time?
Cost, schedule, procurement, valuations and site data are already one dataset, so every dashboard and report is a live view of the project rather than a snapshot someone compiled. There is no report-building step, no reconciled exports and no competing version of the numbers: the figure on the board pack is the same underlying record the project team works in.
Can reports be generated and distributed automatically?
Yes. Reports generate and distribute themselves on schedule, with custom templates per audience and export in multiple formats, so each stakeholder gets the right report in the format they need without anyone assembling it. WIP reporting is built in.
Which performance metrics can be tracked?
Earned value management with CPI and SPI performance indices, workforce productivity tracked over time, equipment usage rates and quality metrics per project, plus custom-defined KPIs for each project. Slipping productivity shows up in the numbers while there is still time to act.
What financial reporting does Archdesk provide?
The financial position of every project, live: cash flow forecasting, budget against actual on every cost line, change order impact and profitability by project, with CVR (cost value reconciliation) built from the same records at project and portfolio level.
Can each role have its own dashboard?
Yes. A drag-and-drop dashboard builder with a widget library of construction metrics lets site, commercial and board each build their own view of the same live data, with role-based sharing, saved templates and live data on any device.
Comparing options? See the 11 best construction reporting software tools.
Explore Related Solutions
Everything below runs in the same system, working from the same live data.
Project Management
Streamline your project workflows from start to finish
Project Budgets
Control project finances and stay in budget
Risk Register
Identify and manage project risks
Document Management
Centralize document handling and access
Project Cost Controls
Monitor and compare your actuals with the estimate
Site Forms
Digitize and streamline your site documentation processes
Site Diary & Daily Reports
Keep the daily site record structured and defensible
Work in Progress Reporting
Monitor completion costs across your whole project portfolio
Discover more
Explore the full range of solutions and find the right fit for your business.
See your next project on Archdesk
Book a demo and walk through a fully worked example project: one platform running everything from winning the work to closing it out.
Book a Demo